The Stochastic Oscillator is a momentum indicator that compares the latest closing price to its recent high‑low range and assists in identifying whether an asset might be overbought or oversold.
This article will delve into the ways the Stochastic Oscillator is read and effectively applied.
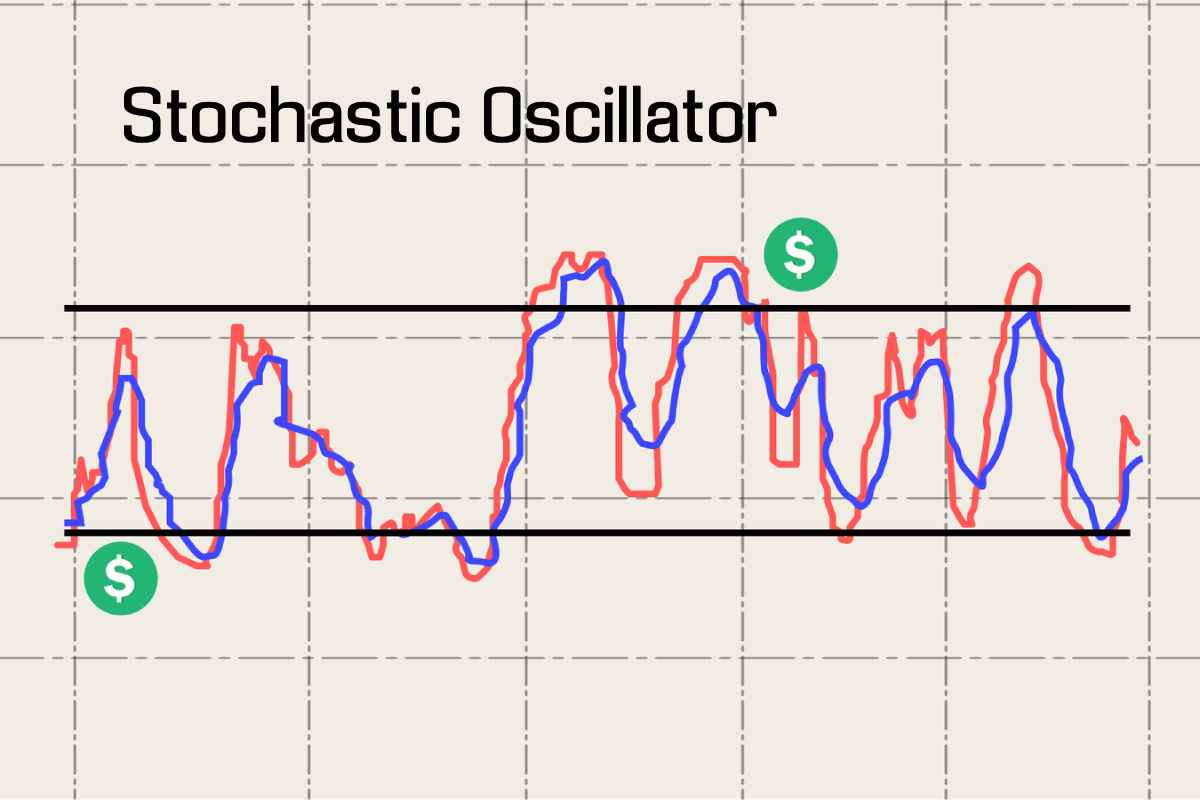
What is the Stochastic Oscillator?
The stochastic oscillator is a momentum indicator that displays how far the position of the current closing price is from its recent high‑low trading range.
To effectively read the Stochastic Oscillator, one needs to interpret its two lines, %K and %D, within the 0‑100 range. Key signals include:
- When the oscillator rises above 80, it means the asset is near the top of its recent range and is thus possibly overbought.
- Readings below 20 mean that the security is near the lower end of its recent range, possibly oversold.
- A crossover in which %K crosses %D can be a potential indication of a change in momentum and entry and/or exit, depending on the overbought/oversold context.
To develop a deep understanding of the stochastic oscillator, you can enrol in a technical analysis course online on Upsurge.club.
How to Apply It in Trading
Now, let’s understand how to apply it in trading step by step.
Step 1: Set Up the Stochastic Indicator on Your Chart
Open a chart of the stock or index you are tracking. If you are trading Nifty or Bank Nifty options, open the chart of that particular index.
Now add the Stochastic Oscillator. Most platforms’ default setting is 14 for %K and 3 for %D. Leave it like that unless you are testing other settings for faster or slower signals.
Step 2: Understand the Two Key Lines
You will notice two lines: %K and %D. These fluctuate between 0 and 100.
- When both are above 80, this is considered overbought.
- For readings below 20 on both, it’s considered to be oversold.
But remember, overbought doesn’t necessarily mean it will fall immediately. It just shows the price has risen sharply in recent sessions.
Step 3: Wait for a Clear Signal
Patience is an important virtue when employing the stochastic oscillator. Don’t act the moment the price touches the overbought or oversold zone.
Watch closely when the %K line crosses the %D line in those zones; that’s your real signal.
A crossover under 20 gives an indication of a potential upward movement, while one above 80 signals a potential fall. Let the indicator always give a clear crossover before entering any trade.
Step 4: Confirm With Price Action and Support/Resistance
When you identify a signal with the indicator, it makes sense to see if the price is responding at a key support or resistance level.
If the price is close to a known support zone and the signal is bullish, it adds strength to your buying idea.
When the price is near a resistance zone and the signal is bearish, it makes the sell idea clearer. This alignment between the indicator and the price zone raises the probability of a successful trade.
Step 5: Open the NSE Option Chain
Switch to the NSE Option Chain of the same index or stock. If your indicator suggests a bullish trend, first check the calls.
Look for strikes with:
- High open interest buildup
- Increasing volume
- Low premiums if you’re buying
- Clear resistance and support zones if you’re selling options
For example, if Nifty is oversold and gives a buy signal, check whether 19500 CE shows strong open interest. That may be a good level to enter.
Step 6: Select the Appropriate Option Strategy
Select an option strategy that is based on signal strength and market view. In case the indicator shows a strong bullish move, you may buy a call or use a bull call spread to limit risk.
You might prefer a defined‑risk structure, such as a spread, over an outright buy for a weak or unclear signal.
Conclusion
The stochastic oscillator shall help the trader understand the momentum of the market and any potential turning point. It helps in better decision-making if combined with other tools and judgment.
Learn to read it clearly, test well, and apply wisely based on your strategy and market conditions. You can gain a better understanding with the trading course or the technical trading courses from Upsurge.club.